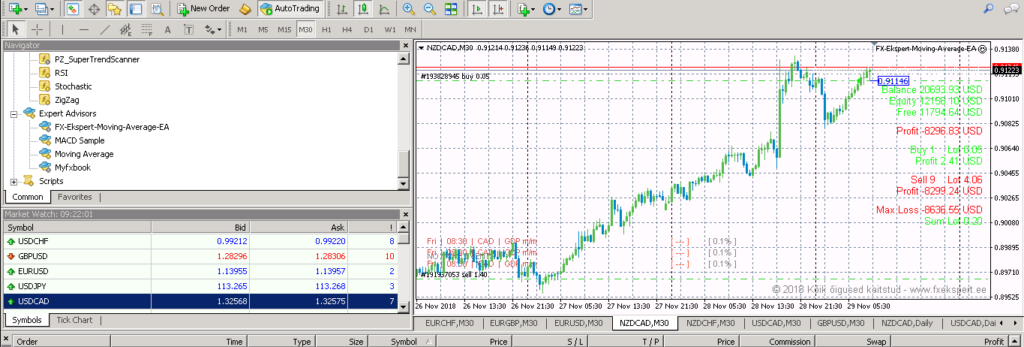
The robot works on a M30 timeframe which doesn’t give much information to analyze the market. One candle represents 30 minutes, so in short on the graph you see little information.

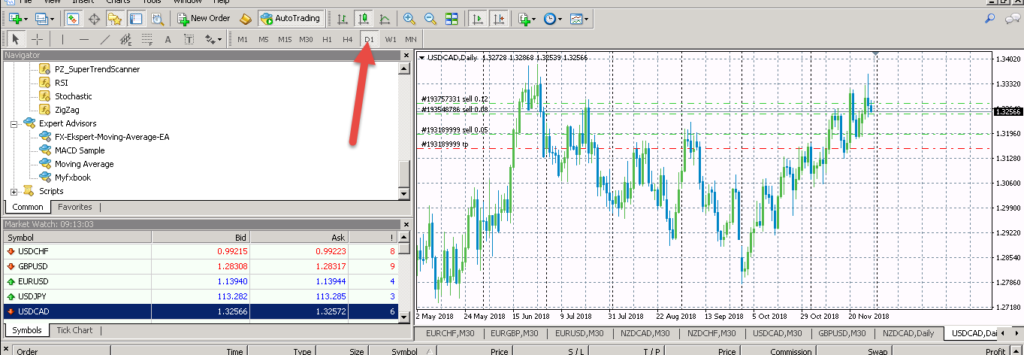
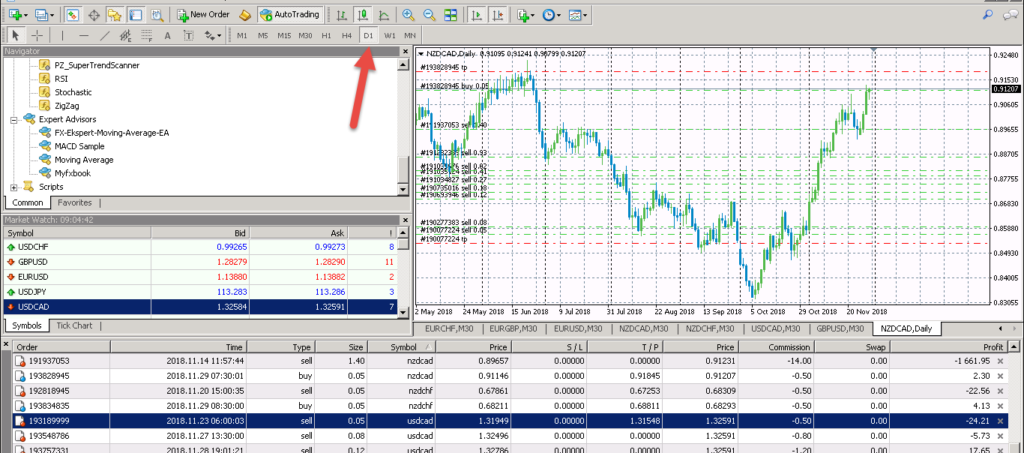
In order to analyze the general movement of a pair in a bigger picture, pick D1 from the timeframe. On this graph every candle represents 1 day of trading. By looking at the graphic below, you can see that the general market movements are way more clear and give us more information.
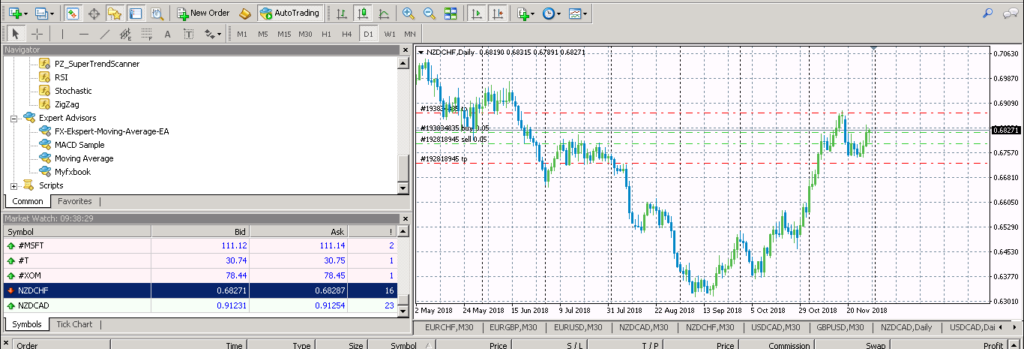
With the NZDCD pair for example, you can see that the robot has opened a lot of new trades during a short period of time and the general movement seems to be going up. In a case like this where the trades are opened so densely together, you can consider closing the trades with a loss.
Most of the time this type of movements don’t appear, but sometimes they do.
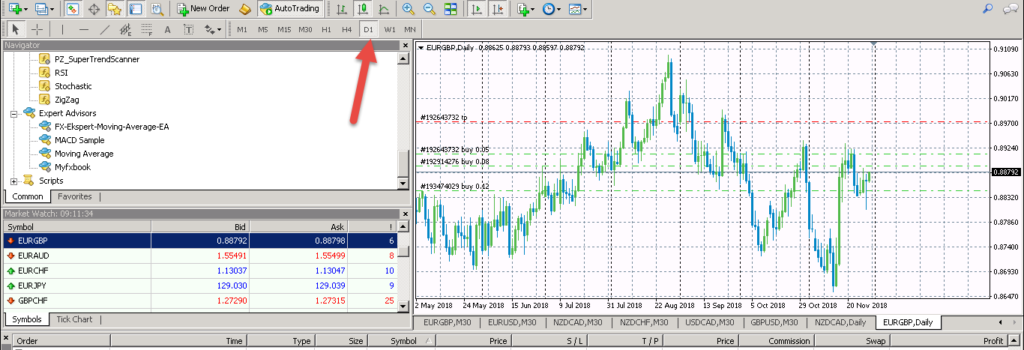
Notice; do not change the timeframe on a graph where the robot is working. Open up a new pair from ‘Market watch’.
For comparison I will be taking the pair NZDCHF, where the robot was working at the same time as the pair NZDCAD.
NZDCHF had pretty similar market movements as NZDCAD at the same time. With this pair the robot didn’t open new trades with small gaps. The drawdown was much smaller and trades for this pair are closed, whereas not yet for the other pair.
In conclusion, if you can see similar circumstances, it would be advisable to close the trades with a loss in order to avoid a bigger drawdown.
Pictures below show normal movement in which case there is no need to intervene.